Another way to present

the data

Quebec Statistiques

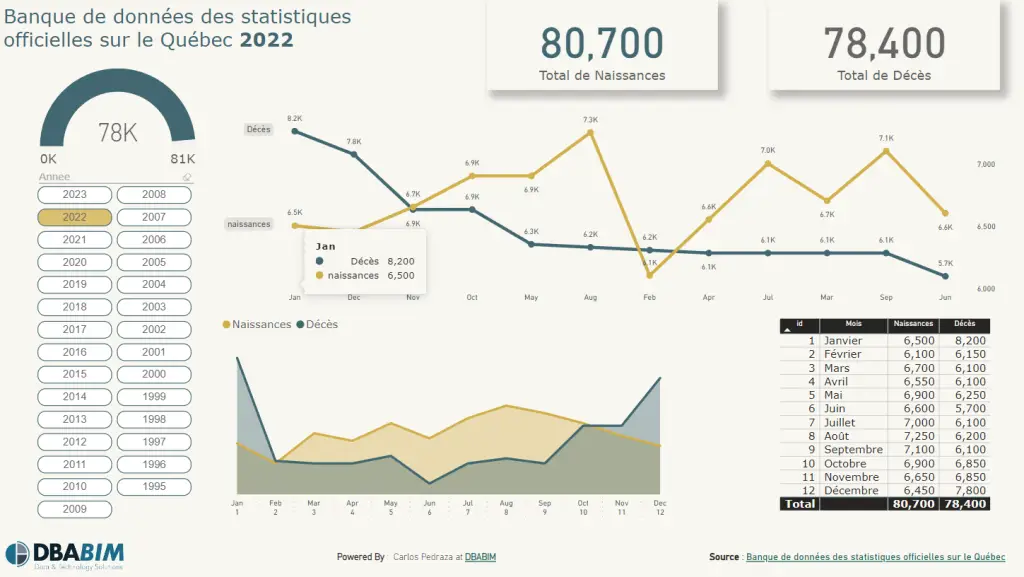
According to Quebec statistics, this is how births and deaths behave monthly and annually. We think of other ways to present those numbers in a graphical mode to make other analyses.

more insights

BIM Data Management in Organizations

Do you ever imagine how helpful it would be if you could make a printable report that automatically extracts the data you need from your model so you don’t have to do it manually? Or would you want to associate those quantities on Revit with a pricing list and have an accurate budget?

Read more
We want to ensure you understand how our website works and why we require your navigation details. Please verify that you have read and agreed to these terms before proceeding.
×